Bollinger Bands: A Guide to Understanding Market Volatility
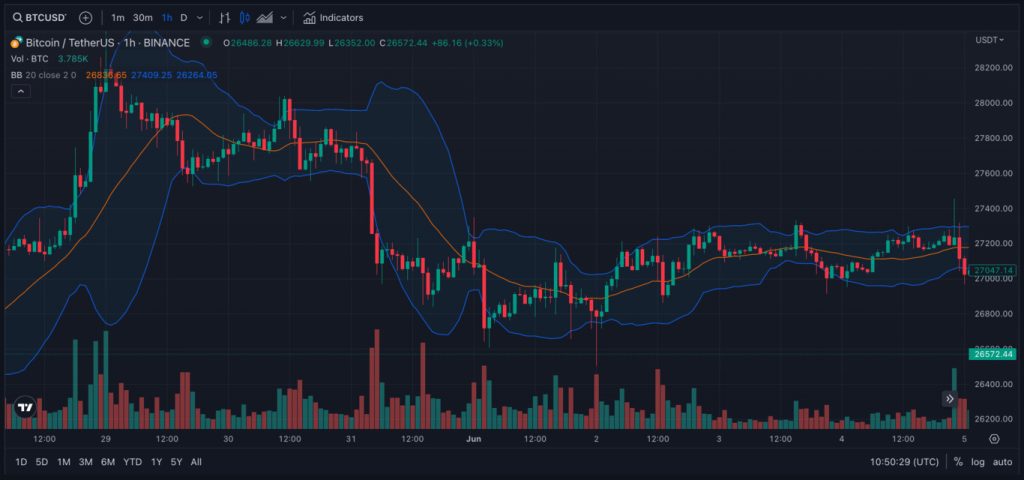
Bollinger Bands are a popular technical analysis tool used by traders to measure market volatility. They consist of three bands – an upper band, a lower band, and a middle band. The upper and lower bands are placed two standard deviations away from a simple moving average (SMA), while the middle band represents the SMA itself. By studying the position and movement of these bands, traders can gain valuable insights into market trends and potential reversal points.
For day traders, Bollinger Bands serve as a reliable indicator of price movement within a given period. Traders pay close attention to the occurrence of a “squeeze,” which happens when the upper and lower bands come closer together and oscillate at the same level. This narrowing indicates decreased volatility and often precedes a significant price breakout. Identifying a squeeze can be an opportune moment for traders to anticipate and capitalize on potential market movements.
Furthermore, Bollinger Bands are useful in confirming trends. When the price breaks out of the upper or lower band, it signifies a potential continuation of the trend. Traders consider such movements as a confirmation of the prevailing market sentiment, providing them with an additional signal to enter or exit positions accordingly.
Long-term investors can also benefit from incorporating Bollinger Bands into their analysis. These bands help identify market tops and bottoms, providing insights into potential reversal points. By observing the position of the price in relation to the bands, investors can gauge whether a stock is overbought or oversold. A stock trading close to the upper band may indicate that it is overbought and could potentially experience a price correction. Conversely, a stock trading near the lower band may be considered oversold, suggesting a potential buying opportunity.
Moreover, Bollinger Bands provide investors with a historical price range for a given security. By analyzing the width of the bands, traders can assess the volatility of a stock and determine an appropriate price range. This information can be valuable when setting profit targets or determining stop-loss levels, allowing for better risk management.
In conclusion, Bollinger Bands are a versatile technical analysis tool that can help traders and investors navigate market volatility. By understanding the position and movement of the bands, market trends and potential reversal points can be identified. Whether you are a day trader seeking breakout opportunities or a long-term investor looking for trend confirmation, incorporating Bollinger Bands into your analysis can enhance your decision-making process and potentially improve your trading outcomes.

